Analyzing the Communication Network of the 2012 COINs Seminar
In this seminar about 50 students from the five universities MIT/SCAD/Aalto University/ University of Cologne/ University of Bamberg worked together for five months in multinational virtual project teams as COINs (Collaborative Innovation Networks). They formed ten teams ranging in size from three to six students from at least two locations, working on a project related to social media and social network analysis (2012 course Web site). Students were asked to cc all their project-related e-mail communication to a dummy mailbox. This allowed us to construct a virtual mirror of ongoing communication within and between teams. At the end of the course, each team presented their results to their classmates in a virtual meeting. Each of the ten presentations was ranked by the students in the three categories “presentation quality, content quality, and creativity”. Comparing the virtual mirror of communication with the peer and instructor ratings permitted us to identify the communication patterns leading to the most highly-ranked work output.
Qualitative Analysis
Looking at the group network below, the different teams can be clearly recognized. The communication of each team is shown in a different color, usually team members are clustered together as a COIN, with external collaborators and other students being in more peripheral positions.

Analyzing the contribution index between team members shows that members of the same team tend to show similar behavior regarding the ratio of e-mails sent to e-mails received. Clusters of dots of the same color are members of the same group, overall we find that higher-performing teams tend to communicate more actively, with more similar send/receive ratios.
The temporal social surface indicates creativity, as there is a relatively large group of high-betweenness class members which is constantly changing over time, in earlier work we found this to be a reliable predictor of creativity.

The 6 snapshots of the 10 teams’ communication networks over the 5 months show Tuckman’s four phases in the life of a team: forming, storming, norming, and performing. We see how the main instructor in the uppermost picture at right is most centrally, but how then teams start connecting in the middle row, and how they then huddle together team-by-team to focus on their work in the bottom-most pictures.

The group betweenness centrality curve as well as the absolute number of messages sent and received shown below illustrate the higher traffic in the forming, storming, and norming phase, followed by the lower traffic in the second performing phase.

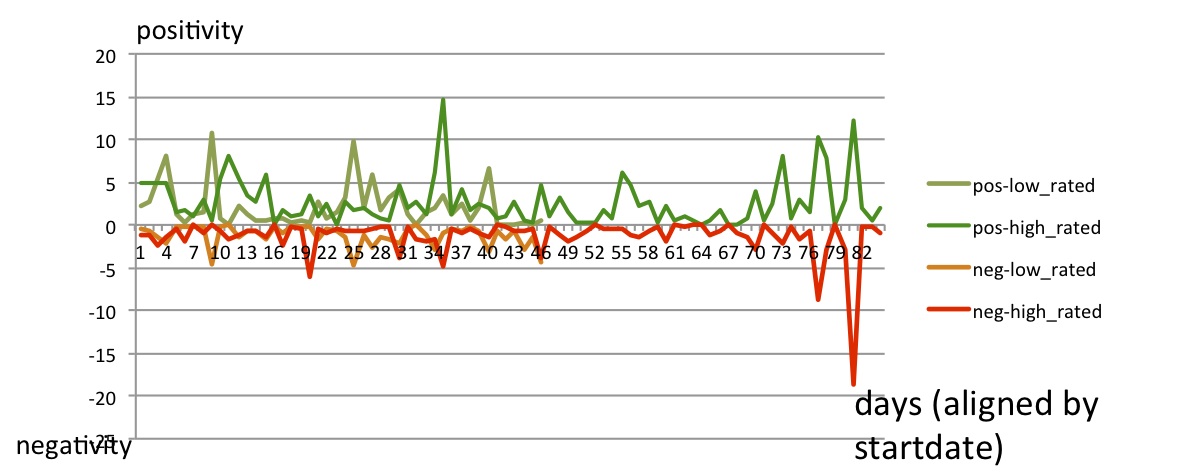
The sentiment curve illustrates the same phenomenon, with higher emotionality (defined as the sum of positivity and negativity) in the forming and storming phase in the first half of the course. X-axis is always days in these pictures.

Quantitative analysis
In the second half of this analysis we investigate what communication patterns will be indicative of high-quality work. The first pattern is “oscillations in betweenness centrality curves”.

The above picture illustrates the team ranked most creative by the instructors (blue shaded lines, each line titled “Series X” is one actor's betweenness over 115 days), and the team ranked least creative (red shaded lines). As can be easily seen, the centrality of most actors in the low-ranked team hovers around the zero-lines: these actors will be peripheral in the social e-mail network shown in the first picture of this document.

As the correlations below illustrate, the instructor rating of creativity (each of the instructors at each of the five participating locations ranked the 10 presentations) correlates highly (0.83**) with oscillation in betweenness centrality. As the picture above shows, the team rated the most creative had 80 oscillations, i.e. handovers in leadership, compared to the lowest rated team with less than 40 oscillations.

A similar correlation was identified for speed of response. The faster a team’s members communicated with the lead instructor, the higher the team’s work output was rated by the other students.

The correlation between the peer rating of a team’s content with its communication balance with the main instructor (Peter) is -0.719**, i.e. the higher the communication balance, the more communication with Peter, the better is the team’s content.

The more emotional the language of a team in the e-mails they exchange, the higher is the content rated by its peers.

The positivity in the e-mails sent to the main instructor is also highly predictive of high ratings in all criteria that have been rated (Presentation, Content, Creativity).

The conclusions for high-functioning teams are therefore:
1. Pass the baton frequently: the more leadership rotates among team members, the more creative the output will be
2. Communicate rapidly with the instructor, and among team members
3. Use emotional language: praise when praise is due, but also say when something is not ok.
Qualitative Analysis
Looking at the group network below, the different teams can be clearly recognized. The communication of each team is shown in a different color, usually team members are clustered together as a COIN, with external collaborators and other students being in more peripheral positions.

Analyzing the contribution index between team members shows that members of the same team tend to show similar behavior regarding the ratio of e-mails sent to e-mails received. Clusters of dots of the same color are members of the same group, overall we find that higher-performing teams tend to communicate more actively, with more similar send/receive ratios.

The temporal social surface indicates creativity, as there is a relatively large group of high-betweenness class members which is constantly changing over time, in earlier work we found this to be a reliable predictor of creativity.

The 6 snapshots of the 10 teams’ communication networks over the 5 months show Tuckman’s four phases in the life of a team: forming, storming, norming, and performing. We see how the main instructor in the uppermost picture at right is most centrally, but how then teams start connecting in the middle row, and how they then huddle together team-by-team to focus on their work in the bottom-most pictures.

The group betweenness centrality curve as well as the absolute number of messages sent and received shown below illustrate the higher traffic in the forming, storming, and norming phase, followed by the lower traffic in the second performing phase.

The sentiment curve illustrates the same phenomenon, with higher emotionality (defined as the sum of positivity and negativity) in the forming and storming phase in the first half of the course. X-axis is always days in these pictures.

Quantitative analysis
In the second half of this analysis we investigate what communication patterns will be indicative of high-quality work. The first pattern is “oscillations in betweenness centrality curves”.

The above picture illustrates the team ranked most creative by the instructors (blue shaded lines, each line titled “Series X” is one actor's betweenness over 115 days), and the team ranked least creative (red shaded lines). As can be easily seen, the centrality of most actors in the low-ranked team hovers around the zero-lines: these actors will be peripheral in the social e-mail network shown in the first picture of this document.

As the correlations below illustrate, the instructor rating of creativity (each of the instructors at each of the five participating locations ranked the 10 presentations) correlates highly (0.83**) with oscillation in betweenness centrality. As the picture above shows, the team rated the most creative had 80 oscillations, i.e. handovers in leadership, compared to the lowest rated team with less than 40 oscillations.

A similar correlation was identified for speed of response. The faster a team’s members communicated with the lead instructor, the higher the team’s work output was rated by the other students.

The correlation between the peer rating of a team’s content with its communication balance with the main instructor (Peter) is -0.719**, i.e. the higher the communication balance, the more communication with Peter, the better is the team’s content.

The more emotional the language of a team in the e-mails they exchange, the higher is the content rated by its peers.
The positivity in the e-mails sent to the main instructor is also highly predictive of high ratings in all criteria that have been rated (Presentation, Content, Creativity).

The conclusions for high-functioning teams are therefore:
1. Pass the baton frequently: the more leadership rotates among team members, the more creative the output will be
2. Communicate rapidly with the instructor, and among team members
3. Use emotional language: praise when praise is due, but also say when something is not ok.


I love the sentiment curve :)
ReplyDelete